
Tests
Reading your results
What every number on the Split Tests and Overview tabs means, and when it is worth acting on.
plain textupdated 2026-10-02
Luria shows you the same numbers it uses to decide. This page reads them with you, field by field, and tells you when a number is worth trusting.
What you'll need
- Luria live on your site with traffic flowing. See Verify your install.
- At least one test running. See How Luria's tests work.
The Split Tests tab
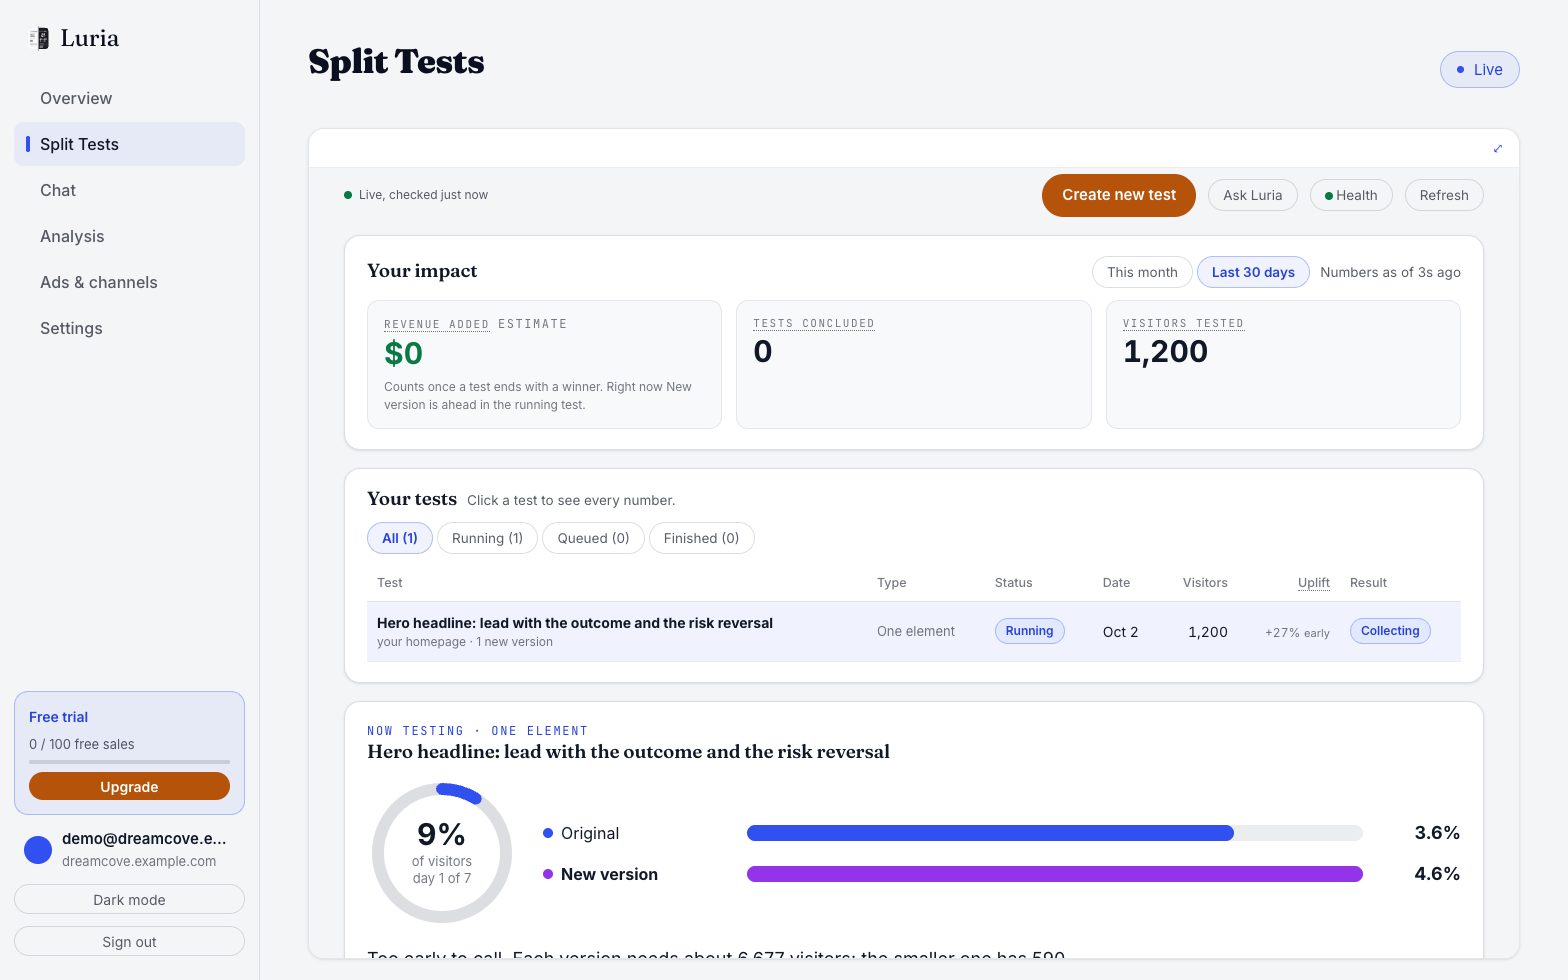
- Your impact. Revenue added (an estimate that counts once a test ends with a winner), tests concluded and visitors tested, for this month or the last 30 days.
- Your tests. Every test with its type, status, date, visitors, uplift (marked "early" while it runs) and result ("Collecting" until it is decided). Click a row for every number.
- The test running now. The original and the new version side by side, each with its conversion rate, and how far along the test is. Under it, a plain line says what Luria still needs, for example how many visitors each version needs before it can call the test.
Open the Classic view fold for the per-test card Luria decides on:
- Name and where. What the test changes, the page it runs on and the element.
- Verdict. "Ahead" or "Behind" once the chance is past 80% or under 20%, "Too early" in between, then "Winning", "Losing" or "No winner" when the test is decided.
- Version table. Visitors, bought, rate, revenue and traffic share for the original and the new version. Visitors counted here are visitors who were actually shown that version.
- Chance the new version wins. The probability that the new version is genuinely better than the original, given the counts so far. Above 95% is the promotion bar. Below 5% and the new version is stopped.
- The gap in pp. The difference between the two rates in percentage points, as a middle estimate rather than a fact. One percentage point on a 2% conversion rate is a 50% relative change, so read pp carefully.
Traffic stays split evenly until each version alone is past 200 visitors. Allocation is recalculated every hour.
The Overview tab
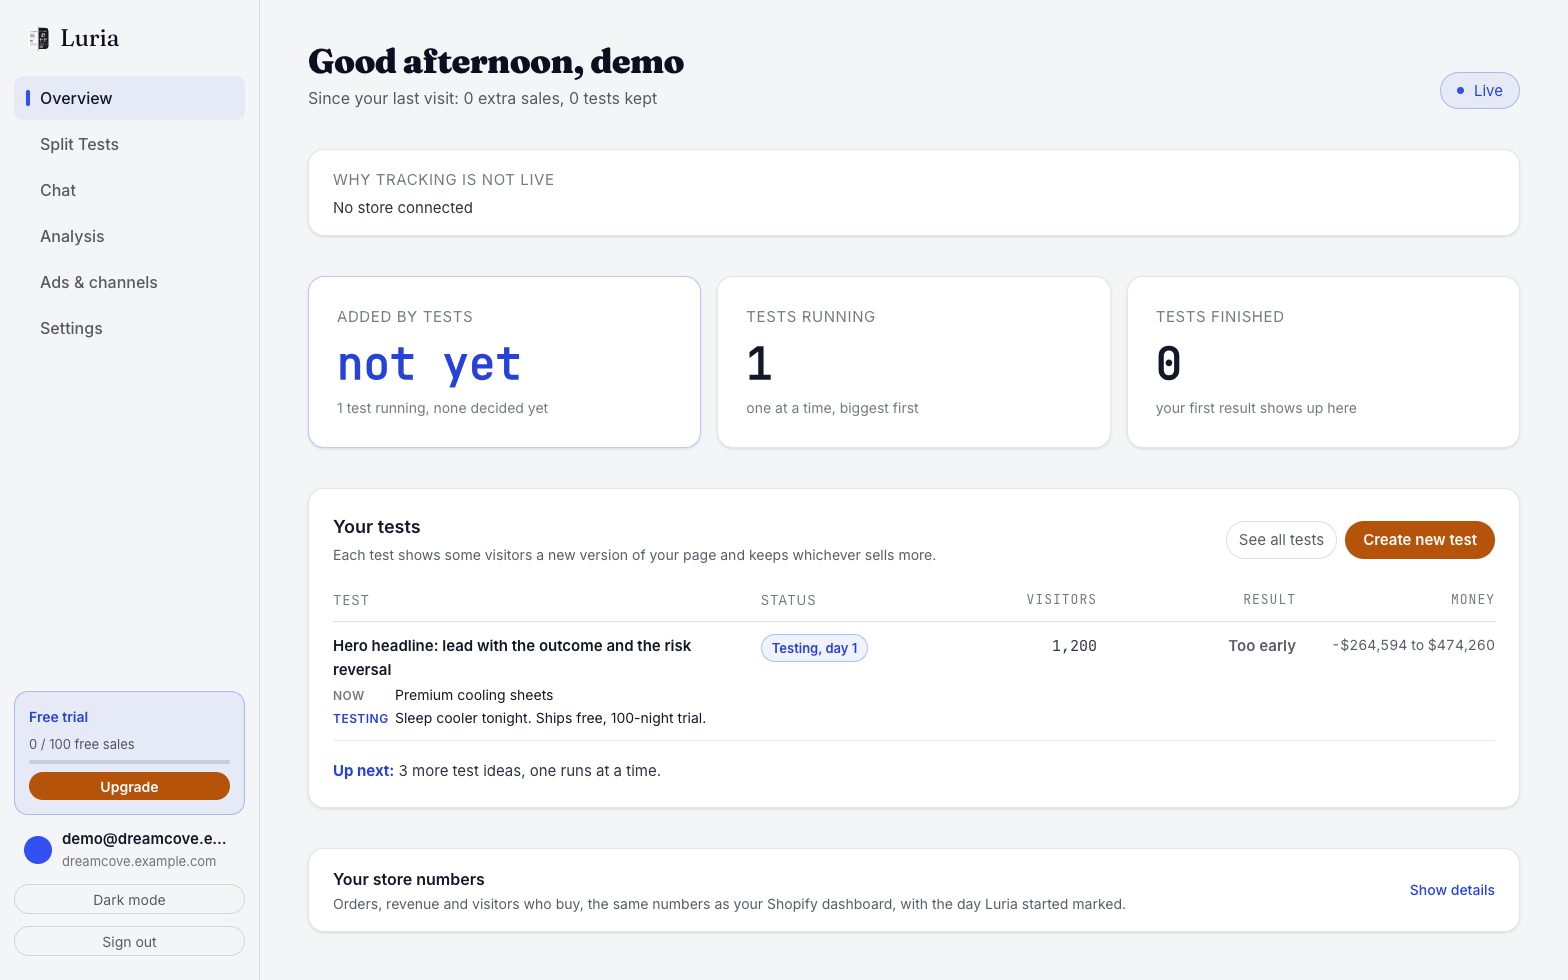
- Added by tests. Money the finished tests added. It reads "not yet" until a test is decided.
- Tests running and Tests finished. One test runs at a time, biggest first.
- Your tests. Each test with its status, visitors, result and a money range. A running test's range is wide on purpose: it is where the result could land, 95% sure.
- Before vs after Luria (folded). Your store against its first 4 weeks. "Change vs before Luria · measured" is a real comparison; "not yet measured" means Luria does not have that baseline yet.
- Your store numbers (folded). Orders, revenue and visitors who buy, with the day Luria started marked. It will not match Shopify exactly; see Numbers don't match Shopify. Revenue is net of fully refunded orders.
Why the numbers move early
Early numbers swing because the samples are small, not because something is broken.
- Under 200 visitors per version the split is held even on purpose, and the chance the new version wins can wander from 20% to 80% on a handful of sales.
- A single large order moves tracked revenue much more than it moves the conversion rate.
- "Before vs after Luria" stays on "not yet measured" until you have four weeks of data behind the baseline.
When to trust a number
- Both versions are past 200 visitors. That is the bar Luria promotes on, and it is the right bar for you too.
- The chance the new version wins is above 95% or below 5% and holding, rather than crossing back and forth day to day.
- The verdict says "Winning". That means the sample bar and the 95% bar were both cleared.
- The comparison says "measured". Anything labelled an estimate is a modelled range, not a measurement.
Common failures
- A test shows 0 visitors. The change is live but no visitor has been shown it yet, or serving is off. See No variants serving.
- "Before vs after Luria" never leaves "not yet measured". The baseline needs four weeks of data. Low traffic stretches every window.
- Conversions look too low. Luria counts attributed orders once each, net of full refunds. See Orders missing and Duplicates.
- The chance sits at 50%. The two arms are behaving the same. That is a real result, and Luria will keep the test running until the gap is decidable.